How to Visualise and Analyse Football Matches Using Data and Python
- Aritra Majumdar

- 29. März 2023
- 5 Min. Lesezeit
Aktualisiert: vor 3 Tagen

Football analysis is no longer driven by intuition alone. To truly understand matches, compare performances and improve decision making, numbers are essential. Match data provides objective insights into what actually happens on the pitch, beyond perception and narrative.
This article explains how football matches can be visualised and analysed through data. The focus is on practical application, clarity and real value for analysts, coaches and decision makers. The goal is not to use more data, but to extract better insights.
We are always open for guest articles to help network and strengthen the analytics community.
This article is from our colleague Aritra Majumdar www.themachineball.com Twitter:@machineball_am
"If you want to go fast, go alone. If you want to go far, go with others." - African proverb.
Why analysing matches with data matters
Numbers and data only create value when they are properly visualised and interpreted. Modern football analysis combines data, visuals and context to understand match dynamics. This article shows how matches can be analysed effectively using numbers.
Hi all! For the past two months, I have been running my analytics page (obviously, views are my own) where I analyse a match, and extract important statistics along with visualizations. I would not completely say that I prepare match reports but most of the important aspects are there, mostly.
Which football data is actually relevant
I extract data from whoscored which is powered by OPTA. In my earlier post I mentioned a way how to extract data from whoscored. I believe it will help anyone to just get started with analysis match by match. Here in this post, step by step we will analyse a match that happened on 20th April 2023 in the Europa League ROMA vs FEYENOORD. Roma won 4-1 in extra time and booked a spot in the semi-final of the Europa League. Jose Mourinho (my all-time favourite manager) again proved that he can lead any team to win a trophy despite it being a 100 million squad or 500 million squad or a 50 million squad.
Analysis aspects:
There are lots of things one can analyse from a match and indeed there are lots of ways. I have always believed in keeping the analysis simple with more numbers. Let's take a look what are the events that generally happen during a match -

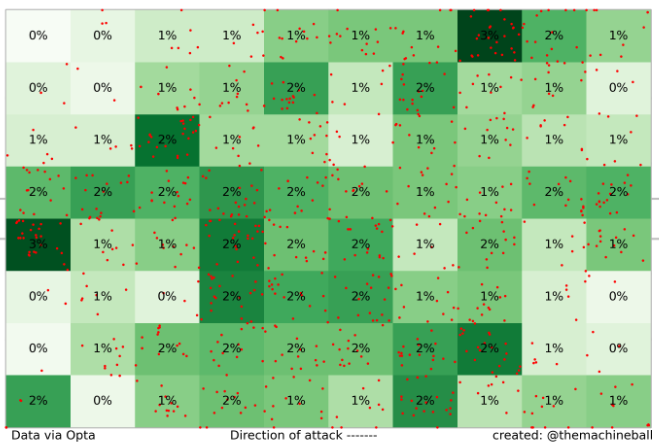
So the above mentioned in the bracket are all events. The definition of each event can be found here. Let's take a quick look at where most of those evets have happened inside the pitch for each team-
Key Data for Match Analysis
Key visualisations for match analysis
Event touch map:
Roma event touch map
Feyenoord event touch map
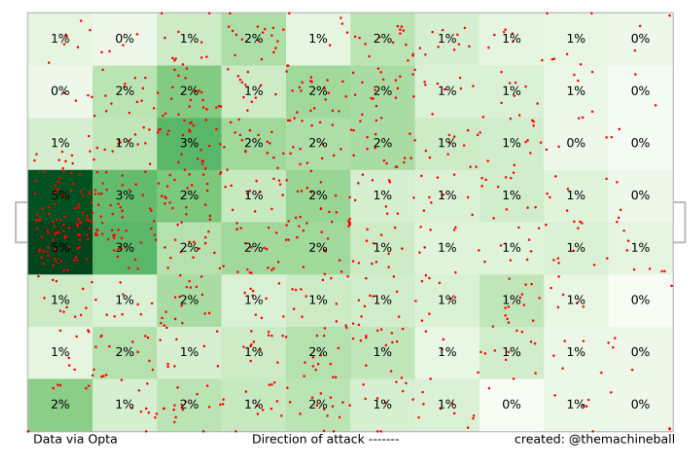
Now, we got an essence that where on the pitch most of the events have happened. One can easily customise the figure with more bins if wanted, also, rather than only event touches one can visualize the zones from where the most passes have been made or shots or anything one wants to. I will give you another example with shots taken by each team-

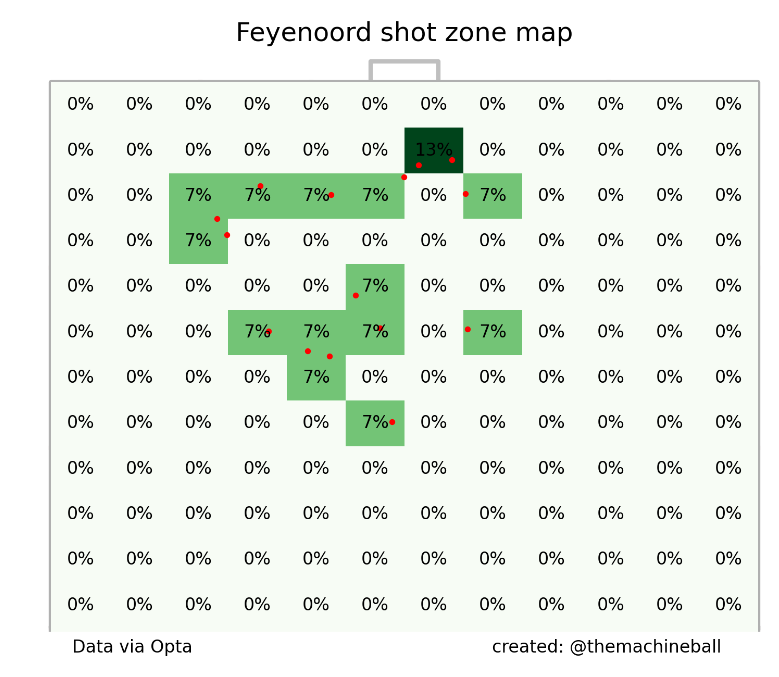
So, now we got one way to visualize events with numbers.
Defensive actions:
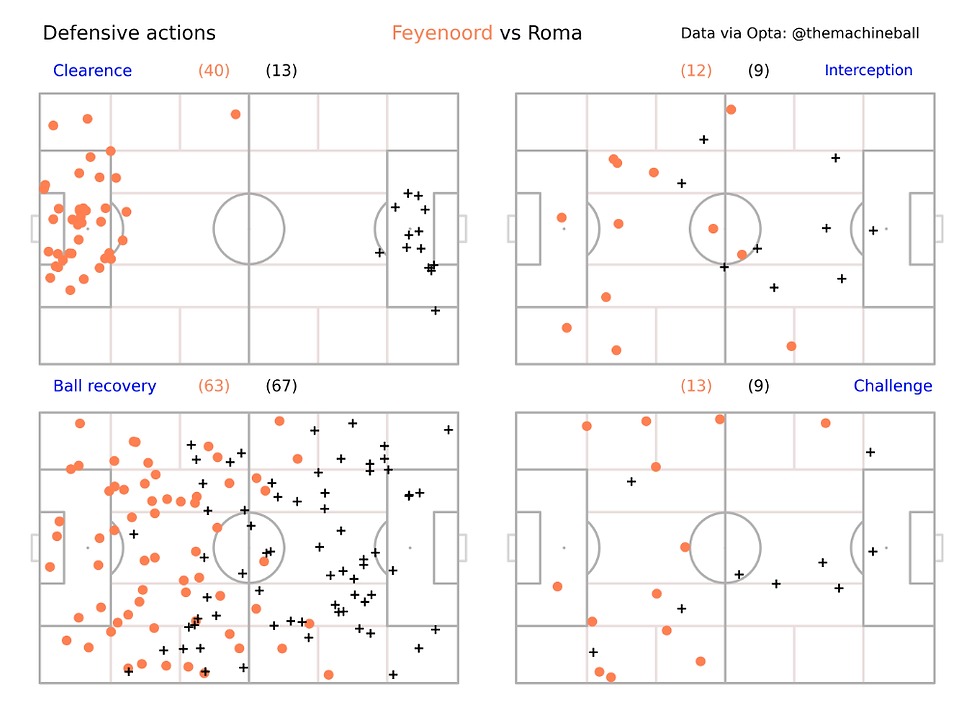
The next event we will analyse is defensive actions. If you go above and look at the events you will easily see terms such as Clearance, Ball recovery, Interception, Challenge, Tackle, and Aerial. We will analyse the first four. One can analyse as per requirements and out of interest. In my opinion, every action (i.e., event) needs to be analysed.
Passing actions:
For our next topic, we will analyse the passing actions. But, simply analysing the passes which is the most happening event on the pitch is not enough. One can produce the above two visualizations with a "pass" event. We will analyse which team produced the most passes to the attacking third and another one's progressive passes, and also how successful and unsuccessful they were.

Roma had more passes to the attacking third and more progressive passes yet maintained a good success percentage.
Expected threat:
Next is the expected threat. We will calculate which player created the most threat from passes. This also gives an essence of which player had the most presence on the pitch as we are calculating from passes.
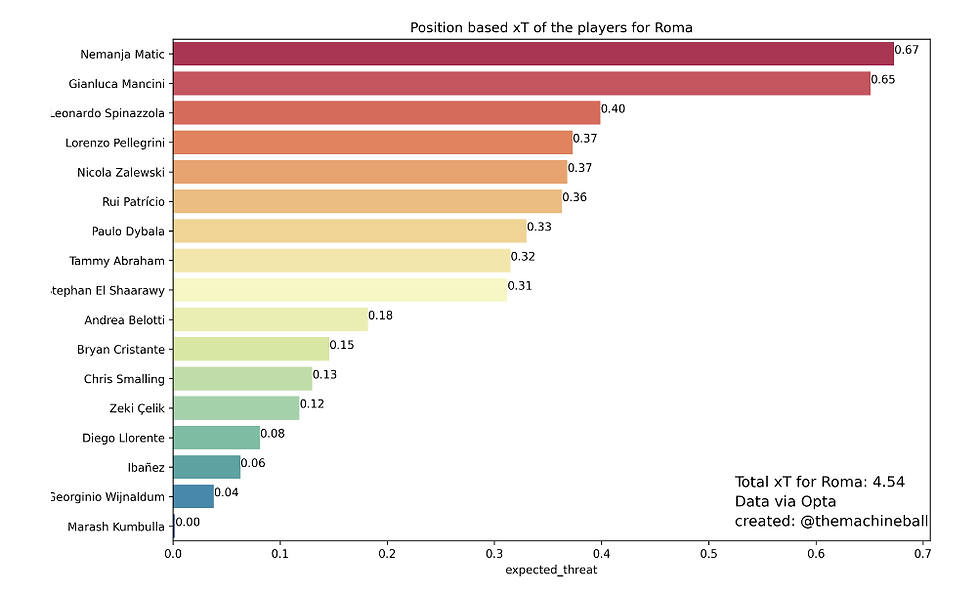

If anyone has seen the match, without watching the match anyone can say that Matic and Mancini were excellent. They both were very good. I believe you all are thinking just because they have the best xT. No, I will give you the proof in numbers.
Individual player actions:
Now we will analyse how Matic and Mancini both performed in the pitch. The performance includes both defensive and offensive actions. Let's take a look -
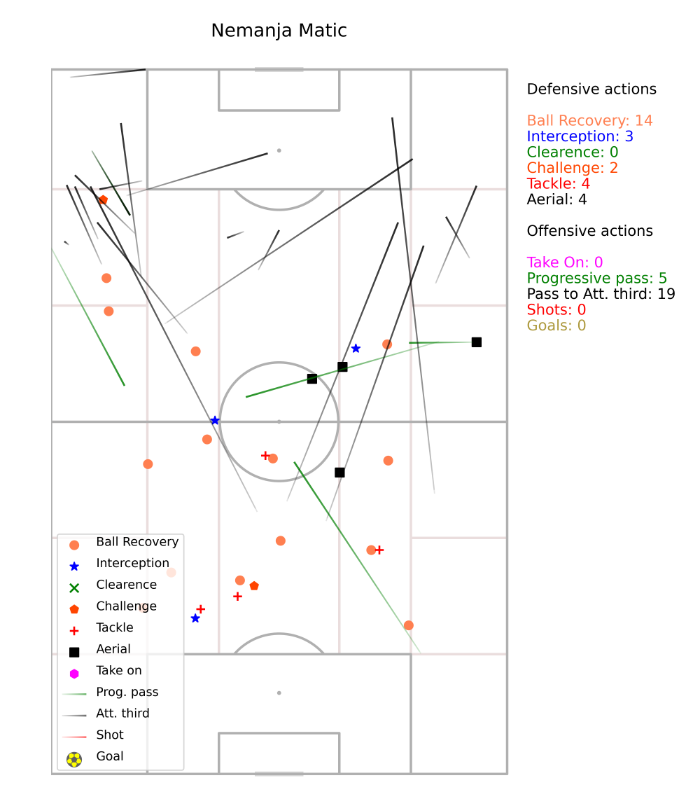

We can take a look at all the actions performed by a player in just one figure. We can improve it by giving more information such as which action is how much successful we will do later at some point in time. It will be more detailed and informative.
Shot analysis:
Our last one is to analyse which team has taken more quality shots. One way to visualize is by calculating the expected goal for each shot. I have prepared my xG model to calculate the chance of scoring for each shot. It is sometimes frustrating that why the xG model is not up to the industry level. One way to infer that industry experts use the maximum features for their xG model. Why can not we use it? We have to pay. I am poor at the moment to pay. But, I have used as many possible features as I can. Still, I need two more important features such as while shooting the distance between the ball and the goalkeeper and pack density (how many players are there between the ball and the posts). While you use stats-bomb data you will easily get those features. From non-paid services, it is very hard to find OPTA data. If someone finds a way to find the necessary parameters please let me know. I will be grateful. For now, let's use my XG model. Not that bad trust me. I only calculate open-play xG. Later I will calculate the set-piece xG model. Let's stick to open-play (regular play) xG.
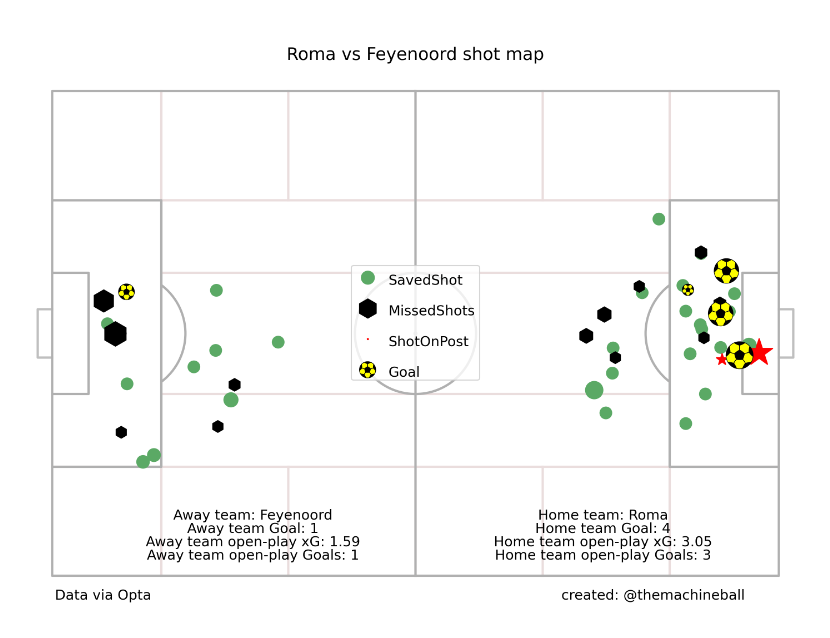
We can see that Roma had 3.05 open-play xG and Feyenoord had 1.59 open-play xG. Cross-check with FOTMOB. Told you not that bad. If you want to check out a single team with xG -
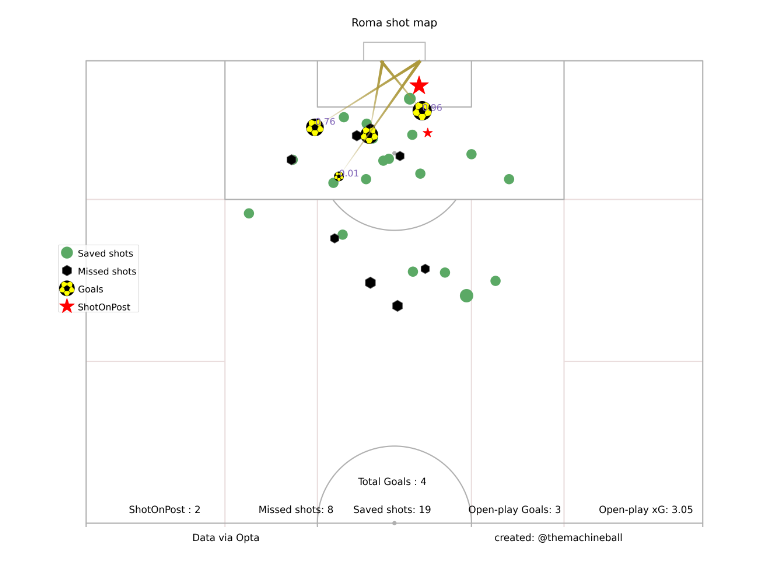
So far we have seen how to watch a match in numbers. More to come like ball distribution from goal keepers, improving the xG model, making the xG model for the set-piece, visualising defensive actions with percentage inside the pitch zones etc.
Did you like the quality of the post? Then reward us with your "credits" and like and share this post within your social network. To not miss any post you can subscribe to the blog.
footballytics – we know how to make the data talk
We support clubs, coaches, agencies and players with analysis and consulting services to use and interpret data. To make better decisions in scouting, in match analysis and on the pitch.
www.footballytics.ch Football Data Analytics - improve the game - change the ǝɯɐƃ
Share this post


