
Expected Threat (xT) the best offensive metric so far
- footballytics

- 10. Mai 2023
- 8 Min. Lesezeit
Aktualisiert: 26. März
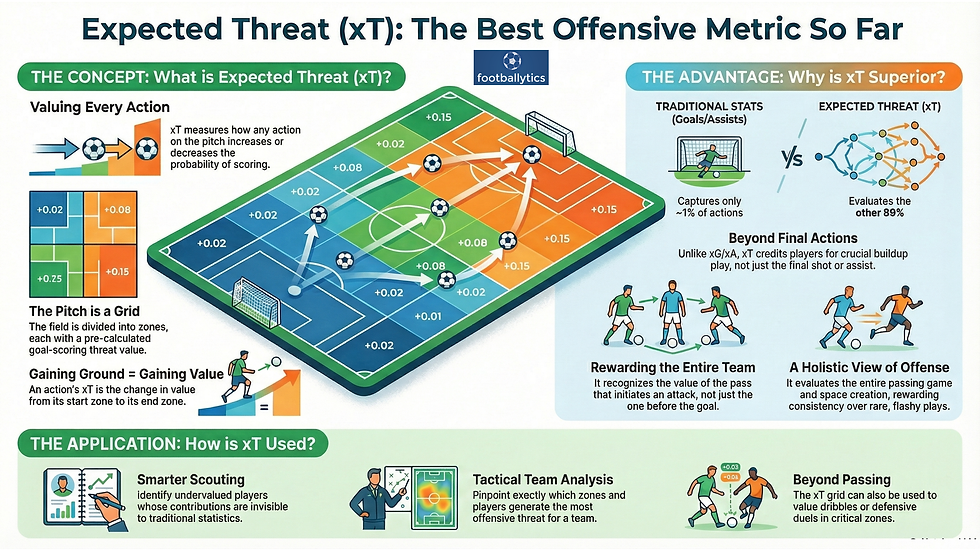
Expected Threat (xT) is a football metric that measures how much a player’s action increases the team’s probability of scoring in the next sequence of play. Unlike xG and xA, xT values all actions that move the ball and contributes to offensive threat.
Expected Threat xT is evolving
Check out the next evolution of xT in our blog, moving from isolated pass events toward a holistic perspective. More context. More depth. More scouting added value. 👉 Expected Threat Chain: Evaluating attack chains in scouting
We will explain the Expected Threat (xT) concept in this blog and at the end we will show the (probably first) Bundesliga leaderboard per position.
What is the best metric to measure a player's offensive contribution?
Is it goals, assists, expected goals, expected assists? Although we may never find a perfect answer to this question. Expected Threat (xT) provides a strong answer.
Unfortunately, both traditional metrics (shots and assists) and their contextual successors Expected Goals (xG) and Expected Assists (xA) are inadequate in addressing this task because they focus on important but very rare actions such as shots and goals.
Goals and shots account for less than 1% of all actions.
But what about the other 99%? What about the actions preceding the scoring chance?
The actions and passes that were executed before the last pass or the shot are not taken into account by xG and xA. Thus, from the player contribution forward, from the offensive contribution of the players quite a lot remains in the dark. The build-up of the game, the shift, the pass through the midfield, the dribbling, the dribbling in the gaps, the acceleration to gain meters, the pass to the wing, etc. are not taken into account.
Ideally, we would like to assign a value to each action performed by a player that indicates how helpful that action was in winning the game.
Progressive or key passes are also only a subset of the forward passing game and can only capture space gain and goal threat in a limited way. But we want to evaluate the entire passing game of a player. Every single forward, lateral and backward pass.
Expected Threat (xT) is holistic and evaluates the entire danger of the passing game
What is Expected Threat (xT)
This is where Expected Threat (xT) comes in. The concept was first introduced by Sarah Rudd in 2011, before being transformed by Karun Singh in 2018 into the most commonly used definition at present.
The concept is both simple and ingenious. The probability of scoring a goal in the next few actions is highly dependent on the distance to the goal. The closer we bring the ball to the goal, the greater the probability of scoring a goal. Logical.
Expected Threat (xT) gives credit and value to all actions preceding a goal or a shot. This can be used to show the involvement of all players involved in an action.
It follows that the most valuable actions, apart from goal kick & assist, are those that bring the ball closer to the goal.
The basic idea of xT is to divide the playing field into a grid, with a goal probability assigned to each cell. Each zone is assigned a value that reflects how likely teams are to score in that location.

Expected Threat (xT) shows how the probability of scoring a goal changes before and after the action. As data basis one uses game event data (event data).
Now we can calculate the xT position value of each pass based on the difference between the start value and the end value. In this way we can give a value to all actions.
Thus, each player continuously accumulates credit on his xT account during a match.
Forward passes get higher value. If he often plays backward passes his xT sum becomes smaller. With xT the space gain contribution of all players can be shown.
xT is so to say the pass memory. It remembers only the great or forward passes, but holistically the sum of the space gain.
There are different expressions of xT. The total sum, xT without standards and throw-ins or xT without crosses. Depending on what you want to look at.
Often (also) in football, the few striking events are overrated in the analysis and the very many banal events are underrated. Here, too, xT provides a remedy, since every single 360-degree pass action is evaluated.
Bayern München vs Borussia Dortmund
Below is an animated 2D sequence from the game of March 6, 2021 FC Bayern vs Borussia Dortmund. BVB loses 4:2 but scores a goal with a great move.
Dahoud (8) at the halfway line shifts to the other side to the advanced Schulz (14),
The latter drives the ball further forward and ties up an opponent. Reus (10) cuts diagonally into the penalty area and is sensationally played on. Reus crosses the ball to the onrushing Haaland (9), who slides it in past Neuer.
Take a look at the attack a few times. Who would you credit with what percentage of Cedit's/share of the goal? (2D Animation by @lastrowview)
With the conventional xA/xG model, only Reus would be rewarded by the assist and Haaland (0.69 xG) by the shot on goal. The strong preparatory work of Dahoud (shifting opens up new possibility spaces) and Schulz (driving the ball, fixing the opponent and passing into the penalty area) would remain unappreciated in the xA/xG data.
With the Expected Threat (xT) model, all players involved in the action will now be rewarded with appropriate values. Also Dahoud 0.05xT and Schultz 0.26xT.
Expected Threat (xT) gives honor to whom honor is due.
Expected Threat (xT) Sums in Bundesliga
t the team level, for example, we can use xT to find out from which zones and with which players our team produced the most space gain and scoring threat.
The following are the graphs of each team. This shows who produced the most xT in which zone of the court. Where we have removed the passes in standard situations. This is a pure open play view. The crosses/crosses are also not included, as they have a high chance rate and we prefer playing to the ground in forward play. In addition, the graph on the right also shows the xT total per player.
We have considered the Bundesliga 22/23 games up to the 31 round. The values are total values and are not adjusted per 90 minutes. Zones that remain empty have no player with a positive xT total.


Bundesliga 22/23 Bests
Here is the overview of all Bundesliga 22/23 teams

Alternative use of Expected Threat (xT) grid
The xT grid can also be used offensively and defensively for actions other than passing. For example, we can assign a different value to a dribble, or a defensive duel won - depending on the importance of the zone. This allows us to evaluate not only the number of actions, but also their importance. It can be assumed that in important zones the opponent pressure is also higher. A won duel in a defensively important zone is rated higher. A dribble in an offensively important zone is rated higher.
The xT grid gives the actions an importance dimension
Bundesliga 22/23 (fair) xT leaderboard per position
In order for us to fairly compare the players, we need to adjust the values.
First, we convert the xT total into a value per 90 minutes.
Obviously, players from teams with a lot of possession have more time to make their xT passes. Therefore we add the team possession as a second factor and calculate the xT value to 50% possession. More about the method can be found in our blog Compare players fairly.
So we can present you the Bundesliga ranking. We have only considered players with at least 800 minutes of play and of course we do this per position.
Goalkeepers xT
xT not very relevant for the goalkeepers. The more you combine out the back, the less.

Center Backs xT

Fullbacks & Wingbacks xT

Defensive Midfielders xT

Central Midfielders xT

Wingers & Attacking Midfielders xT

Forwards xT
xT is of course not the most important metric for a striker. Nevertheless, it shows who is able to move sideways or back from the center and who can put his teammates in the scene well.

Bundesliga footballytics xT Dreamteam
Here's the Expected Threat (xT) dream team with the highest possession-adjusted p90 scores.

Bundesliga U24 footballytics xT Dreamteam
From a scouting point of view now only players up to and with 24 years of age

Data Scouting with Expected Threat (xT)
In scouting, event data and also expected threat are still little used.
Offensively, the focus is mainly on expected goals (xG) and expected assists (xA).
But this way 99% of the pass spectrum is not considered.
It makes sense to consider Expected Threat in scouting, because space gain is relevant for every position. Or with several players of equal value, the holistic view with XT can make the difference.
A good xT player, no matter in which system, finds solutions to win space with his passes and to produce scoring danger.
The designated xT contribution of the players can surprise our perception, as our mind runs the risk of being blinded by the few shiny actions. And to disdain the many banal actions.
A club that uses not "only" quantitative data but also event data and xT in scouting has advantages. It is able to identify players whose offensive value is less obvious and players that the other clubs don't have on their radar. Because they work with a different scouting glasses and a different scouting "sieve".
If you scout like the masses, you will only find (expensive) mass players
Because everyone has access to the data. But only a few also have the culture, the skills and the processes to get the best out of the data.
For current occasion still the xT yesterday's Champions League game ManCity 4-0 Real Madrid


Check out our lead article who is read 900 times per month: Data Analytics in Football
And our scouting article Moneyball: Exploiting Potential with Smart Data Scouting
Find valuable insights with Data Analytics:
Custom Football Analytics and Data-Driven Scouting Solutions
Our skills and experience combine deep tactical knowledge with proven innovation methods such as design thinking and systemic approach. T
More on Football Analytics
Data is transforming football in a lasting way. If you want to understand how modern football works with data, explore our content on football analytics, data-driven game analysis and data driven scouting.
Understanding the Basics
Data Analysis in Football – Learn how football analytics has evolved, which metrics are crucial, and how professional clubs use data in practice.
Data Driven Scouting
Data Scouting in Football – How data-driven scouting approaches identify talent and create sustainable competitive advantages.
Player Scouting with Similarity Algorithms – How Algorithms Transform Scouting: Identifying Tomorrow’s Stars with Data
Understanding Metrics
Expected Threat (xT) – The next xT Evolution. One of the most important metrics in football for evaluating every single offensive action based on data and assessing players’ impact more precisely.
Tactical Innovation in Football
Tactical Innovation in Football – How new ideas and data-driven approaches are changing the game, including concrete real-world examples.
Learn Analytics
Learn Football Analytics - 30+ videos and podcasts, explained in a concise, understandable, and practical way.
For Clubs and Agencies
Football Analytics Services – Data analysis, scouting, and customized solutions for better decision-making in professional football. Follow us on LinkedIn for case studies, analyses and new football analytics approaches.
Did you like the quality of our aticle? Then reward our lifeblood with your "credits" and like and share this post within your network. Thank you very much.
To never miss a post, you can subscribe to the blog here.
footballytics – we know how to make the data talk
We support clubs, coaches, agencies and players with analysis and consulting services in the use and interpretation of data. To make better decisions in scouting, in match analysis and on the pitch.
Work with a partner, not just a platform. Here you find a description of our services
Blog von www.footballytics.ch
About Data Analytics in football. improve the game - change the ǝɯɐƃ
Share this post


